# Using Claude to improve throughput by 3x
This past month we've been re-architecting autumn after hitting bottlenecks as our volume grew. To roll it out successfully, we conducted rounds upon rounds of load testing to not only ensure that our infra was stable, but to also push the limits of how much throughput we could handle.
I wanna share how we used Claude to do this because it was truly a game changer compared to the way we historically did things. We moved about 10–20 times faster than before, and tested ideas we'd have overlooked if we were doing things ourselves, but that ended up making a real difference!
### The iteration loop
Firstly, I'd like to talk about our approach to infra and load testing, which is very much experimentation driven. If you're new to infra, this can feel a little unintuitive because writing software is usually logical and deterministic. For instance, if you're debugging an issue where a user pays $20 instead of $40 in your app, it can usually be traced back to a line of code. With infra however, a DB CPU saturating at 100% can be and often is due to an array of reasons.
What this means is that the best approach to debugging infra issues is through experimentation. A good way to visualize this is as a loop:
To demonstrate this with an example, let's say you saw a spike of 5xx errors occur today.
- **Hypothesis:** After looking at our DB metrics, we noticed a spike in connections being opened on Postgres, which caused the stall.
- **Fix:** Set a minimum pool size so there are always warm connections ready to handle a burst.
- **Experiment:** Replay the same traffic twice: once without the fix to reproduce the spike, then again with the minimum pool size set.
If the spike disappears, that supports our hypothesis. If not, we'd look at the results and repeat the process. The same approach works for performance optimizations too.
It's for this exact reason that Claude is so effective when it comes to working on infra. Being a feedback loop, it's a job particularly suited for autonomous cloud agents. You don't need to babysit each step of the process, you really only need to approve the hypothesis and maybe the fix, while Claude does the rest.
More than that, a big part of the process we described above involves sifting through huge amounts of information from various systems and connecting the dots: your database, server, background workers, queues, etc. We wrote an article about how agents are particularly good at that [here](https://useautumn.com/blog/building-an-ai-agent-to-investigate-support-tickets), but to be honest, it's a pretty well known fact by now!
### The set up
Now that we've established why agents are so effective at driving the process we talked about above, let's go through how we set this up for ourselves. First, I'd like to briefly explain how our load tests are set up and run. There are three main parts to it:
**A. Replicating our production database**
First, our staging DB, the one used for load testing, is a snapshot of our prod one. We do this by creating a branch in Planetscale and copying over a Point-in-time (PITR) back up to it. We then remove sensitive data (secrets, keys, PII) and ensure all settings match prod 1:1.
**B. Capturing a snapshot of prod traffic**
Next, we save a snapshot of prod traffic starting around the same point in time as our DB back up. We do this by querying Axiom, which stores every request that comes through our server and saving it to S3. This lets us run real workloads that we see in prod during our load tests.
**C. Running the load test**
Finally, we use Modal to spin up the generators that replay this traffic against staging. We built a few toggles so we can easily change the conditions of each test: scale traffic up to 5× prod, choose how much of the snapshot to replay, and decide whether to prewarm the caches or start cold. This lets us create the 'right' environment for the load test, like a sudden burst of traffic, our services suddenly restarting, etc.
The main idea here is that when it comes to load tests and working on infra, it's important to have an environment that matches prod as closely as possible. When working on a performance fix, Claude can be pretty good at spinning up a bunch of typescript files that act as 'benchmarks' to prove performance gains. However, these benchmarks run locally and only test the change in isolation.
Issues in prod usually surface in an environment where there are a thousand gears shifting at a time, and so it's important to measure and observe fixes in that same environment. For example, there's been many such cases where we've seen Claude 'prove' that something results in 2x throughput through scripts, but when actually load tested against, the improvement was less than 5%.
### Connecting Claude to our load testing environment
Now comes the fun part: how we connected Claude to our staging environment and essentially let it autonomously run load tests. We built an internal dashboard and API for all the operations Claude might need to run load tests autonomously, which is then exposed via an MCP:
- **Deploy code:** deploy a branch to staging and check when it’s ready.
- **Scale the infra:** add more servers, resize them, or change the database size.
- **Tune settings:** adjust connection pools, environment variables and runtime config.
- **Prepare a test:** refresh staging from prod, capture traffic, and clone customers to simulate growth.
- **Run load tests:** choose the traffic level, test warm or cold caches, and queue up tests at increasing load.
- **Inspect the results:** read test metrics and compare runs.
On top of this, we give the agent additional MCP access to the same observability data we use in prod: logs, DB metrics, AWS cluster metrics, etc. This gives it the context it needs to understand and debug each load test. Btw, huge shoutout to PlanetScale (for their [Insights](https://planetscale.com/docs/vitess/monitoring/query-insights) feature) and [Executor](https://executor.sh/) for making this part so easy!
After all this, Claude basically has all the tools it needs to autonomously drive the loop we described above. One thing I'd like to point out is that for Claude to be truly effective at this, you need to close the loop. If there's even a single gap in the process, for example, it can't deploy to staging without your approval, it becomes an order of magnitude less efficient because every iteration is now blocked waiting on you.
### The process and results
Finally, let's talk about how we actually used the set up above to optimize our infra. To begin with, I set a target for Claude: pass a load test at 3x our peak prod traffic. To achieve that, I knew the bottleneck, and hence first place to look, would be at optimizing CPU performance. To briefly explain why, here's a simplified version of our system:
When a customer uses a credit and we receive an event, we deduct from that customer's credit balance. This process must be atomic, and how we achieve this is that our balance worker service is split into N partitions / instances, where each instance handles a segment of customers. A single customer's events are always sent to that same balance worker instance which serializes the deductions keeping it atomic.
We can add more instances to handle more customers, but that doesn't help when a single customer sends a lot of events. Their deductions still have to run one at a time on the same worker. So to handle more traffic from that customer, we needed to reduce the CPU time each deduction takes.
**Directing Claude to optimize CPU performance**
Initially, I assumed that most of the CPU time was spent doing the deduction itself, so I directed Claude to focus on optimizing that part. I used Capy.ai and got a Captain (essentially a project manager for Claude sessions) to spin up 4 to 5 Claude threads, each exploring a different way to optimize the deduction process (eg. getting rid of expensive libraries like Zod or Decimal.js). Here were the results:
As an aside, using Claude to explore multiple ideas in parallel is really effective because you're almost 'pipelining' the iteration cycle and moving even faster! Each of the sessions above was driving its own loop. While one session ran a load test, another could prepare its next change or analyze results from a previous run. You can imagine it looking something like this:
Anyways, I thought it was really interesting to see the same idea behind CPU pipelining apply to Claude sessions!
**Analyzing our initial load test runs**
If you look at the results above, none of the ideas actually resulted in a meaningful improvement. But here's the really interesting part. I had left Claude running overnight and didn't explicitly tell it to stop after trying out these initial ideas. It was simply given the goal of surviving 3x peak prod traffic. So using the results from the initial load tests, Claude analyzed all the various data points and realized two things:
A. It noticed that the same load test could produce inconsistent results, with CPU efficiency varying by up to 2x between runs. It turns out that ECS Fargate was assigning our tasks different chips, some much more performant than others. Here's what we saw across our load tests:
B. It realized that most of the CPU time wasn't actually spent on the deduction logic we were trying to optimize, but on the 'plumbing' around it: handling HTTP requests, parsing and serializing JSON, garbage collection, etc.
To fix the first issue (Fargate assigning us old chips), we basically started deploying our balance workers through an EC2 instance managed by ECS. This way we could select a performant chip, and the instance we went with was the AMD Genoa, which was up to 2x more efficient than Fargate chips if you look at the graph above.
As for the second issue, the fix was slightly more involved. We gave each balance worker task an extra core to handle CPU-heavy work like garbage collection, leaving one core dedicated to processing and serializing deductions. In our load tests, this increased each worker’s peak throughput by roughly 1.8x.
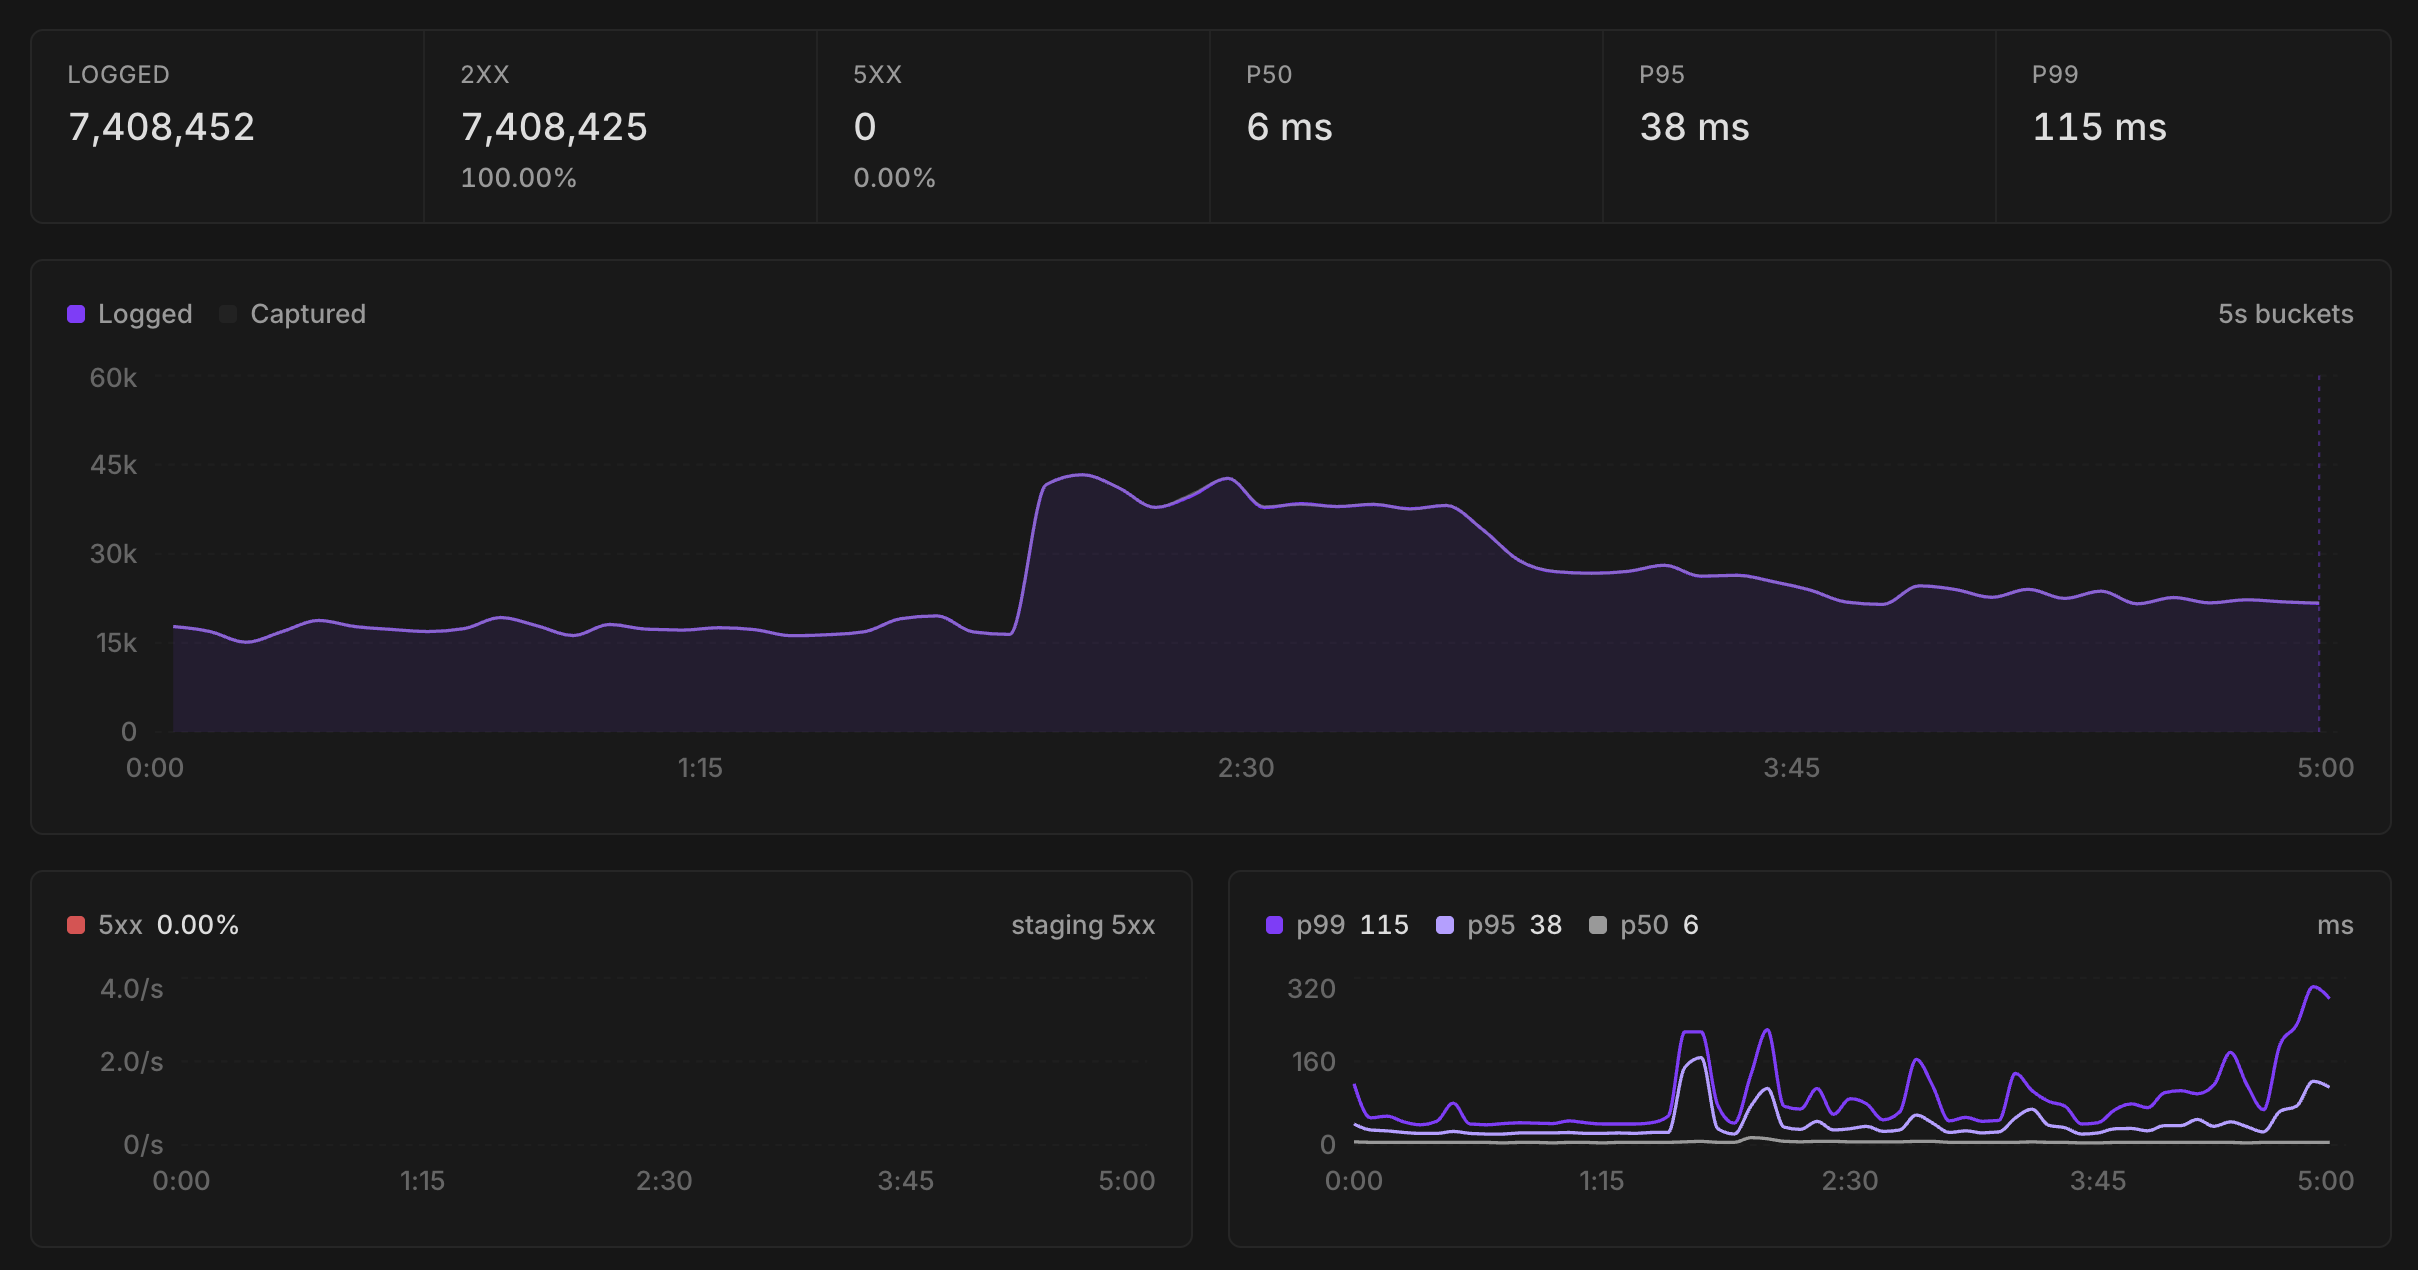
In any case, with these two fixes in place, the peak throughput we could handle on a single balance worker task probably increased by 2x - 3x, which was more than enough to handle the throughput target we initially aimed for. The bottleneck now moved to other parts of the system! After running the iteration loop a couple more times and optimizing a bunch of other areas, we finally managed to handle 3x our peak throughput with zero errors and a reasonable P99!
### Conclusion
Over the course of a weekend, Claude tested 19 ideas, we shipped 7 of the changes, and we managed to handle 4× our peak production traffic in staging:
I'm still pretty amazed at how this turned out to be honest. Going through this entire process might've taken up to a couple weeks without AI, but instead it was done in one weekend, and fairly autonomously as well! If you're dealing with infra, I'd definitely encourage you to try building your own self driving loop. And if you have any questions, feel free to reach out :)
---
Source: https://useautumn.com/blog/everything-we-learned-after-running-100s-of-load-tests
Section: Blog
Last updated: 2026-10-10