If you've ever dealt with a memory leak, you probably know that the easiest thing to do is ignore it. Leave it alone, recycle your tasks / processes frequently enough and everything will be fine. Or so we thought, until last month we realized our tasks were going from baseline to memory limits (OOM) in less than a day. This was definitely abnormal, so we decided to hunt down these leaks once and for all.
I wanted to share how we ended up eliminating these leaks because most of our findings turned out to be non-unique to our codebase and therefore could happen to anyone. Before we dive into it though, I'd like to mention a couple things:
- Huge props to Owen (our founding eng) who basically handled this entire piece of work!
- Most of the leaks we found turned out to be Bun related. Our app runs on Bun v1.3.14, and these fixes were done before v1.4 came out. We haven't migrated yet, but a huge part of Bun v1.4 is eliminating memory leaks, so that is probably a good first step if you find yourself encountering some of the leaks we're about to discuss
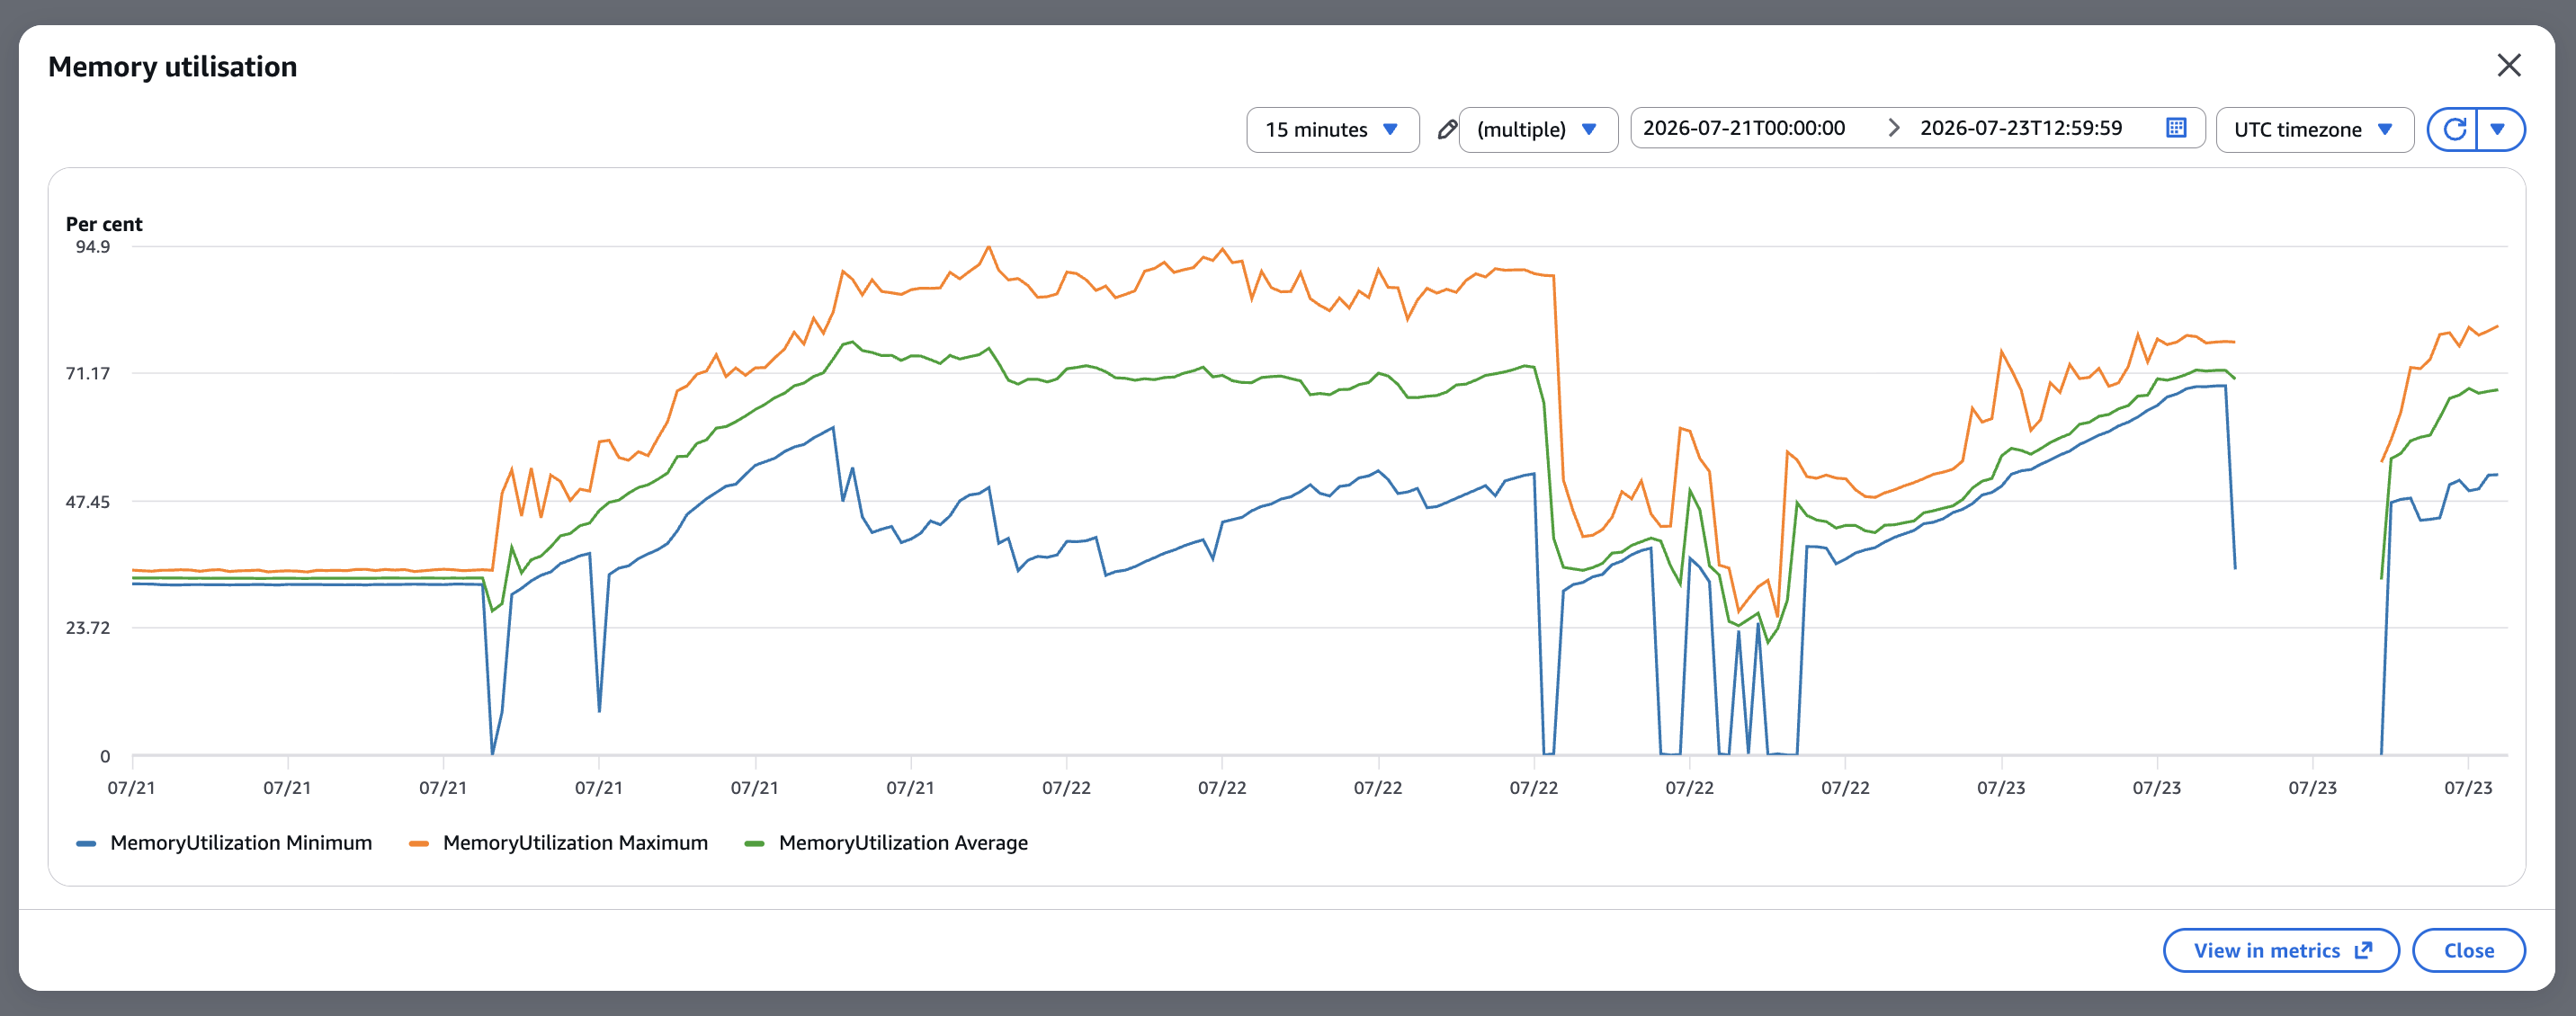
- Our app is a Hono server running on Bun, deployed on AWS ECS. To give you a baseline, the following graph shows our memory growth before any work was done:
Bun HTTP client leaks
The first thing we discovered was that Bun's HTTP client leaks. You can think of a fetch request like this:
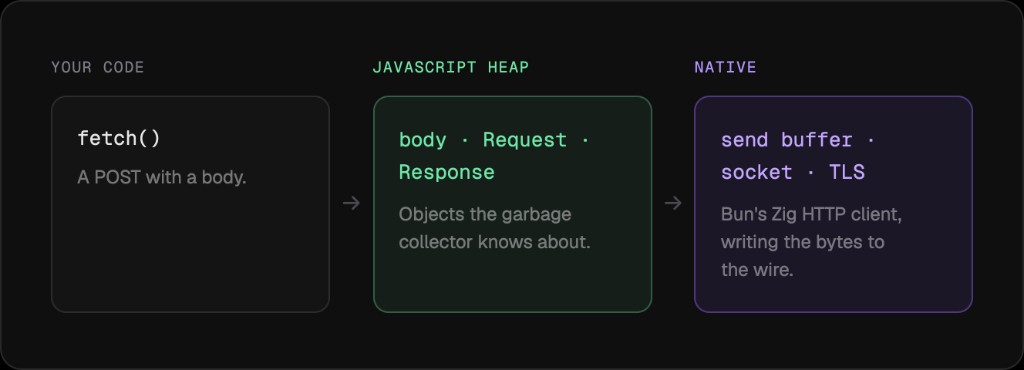
After doing a couple load tests and digging through Bun's issues (oven-sh/bun#30415, oven-sh/bun#18488) we found out that Bun keeps some memory at the native layer even after the request completes, therefore introducing a memory leak (at the RSS level). Essentially, every time you make an outgoing fetch request, a little bit of memory gets held up. As you can imagine, the leak is made worse by the frequency of outgoing requests, and one place which we found to greatly exaggerate this leak was our logs.
Our app uses the pino library for logging and Axiom is where we store our logs. Now, to send logs from our app to Axiom, we use the @axiomhq/pino library which sends batches of logs to Axiom via HTTP every 1k events (or every second). We log every request / response and their payloads to Axiom, so at our volume of around ~500k requests per minute, that's a lot of leak that accumulates!
To solve this, we started writing logs to stdout instead (a one-line change to the Pino transport). We then used a FireLens sidecar (FluentBit) in the same ECS task which reads stdout and sends the logs to axiom. Since the HTTP request to Axiom is no longer in the main Bun process, that leak path is now gone.
Same leak, now in the OTel exporter
Similar to our logs, our OTel exporter was also sending traces to Axiom via fetch. At the time, every Redis command shipped a span, which again accumulated across the throughput of requests we were receiving.
Unlike our logs however, exporting traces in a sidecar would've involved much more work. This is because we already had FireLens set up to export stdout, and all we needed to do for logs was start sending it to stdout, instead of directly to Axiom. So for traces, we instead sampled a small percentage of Redis commands and only exported those.
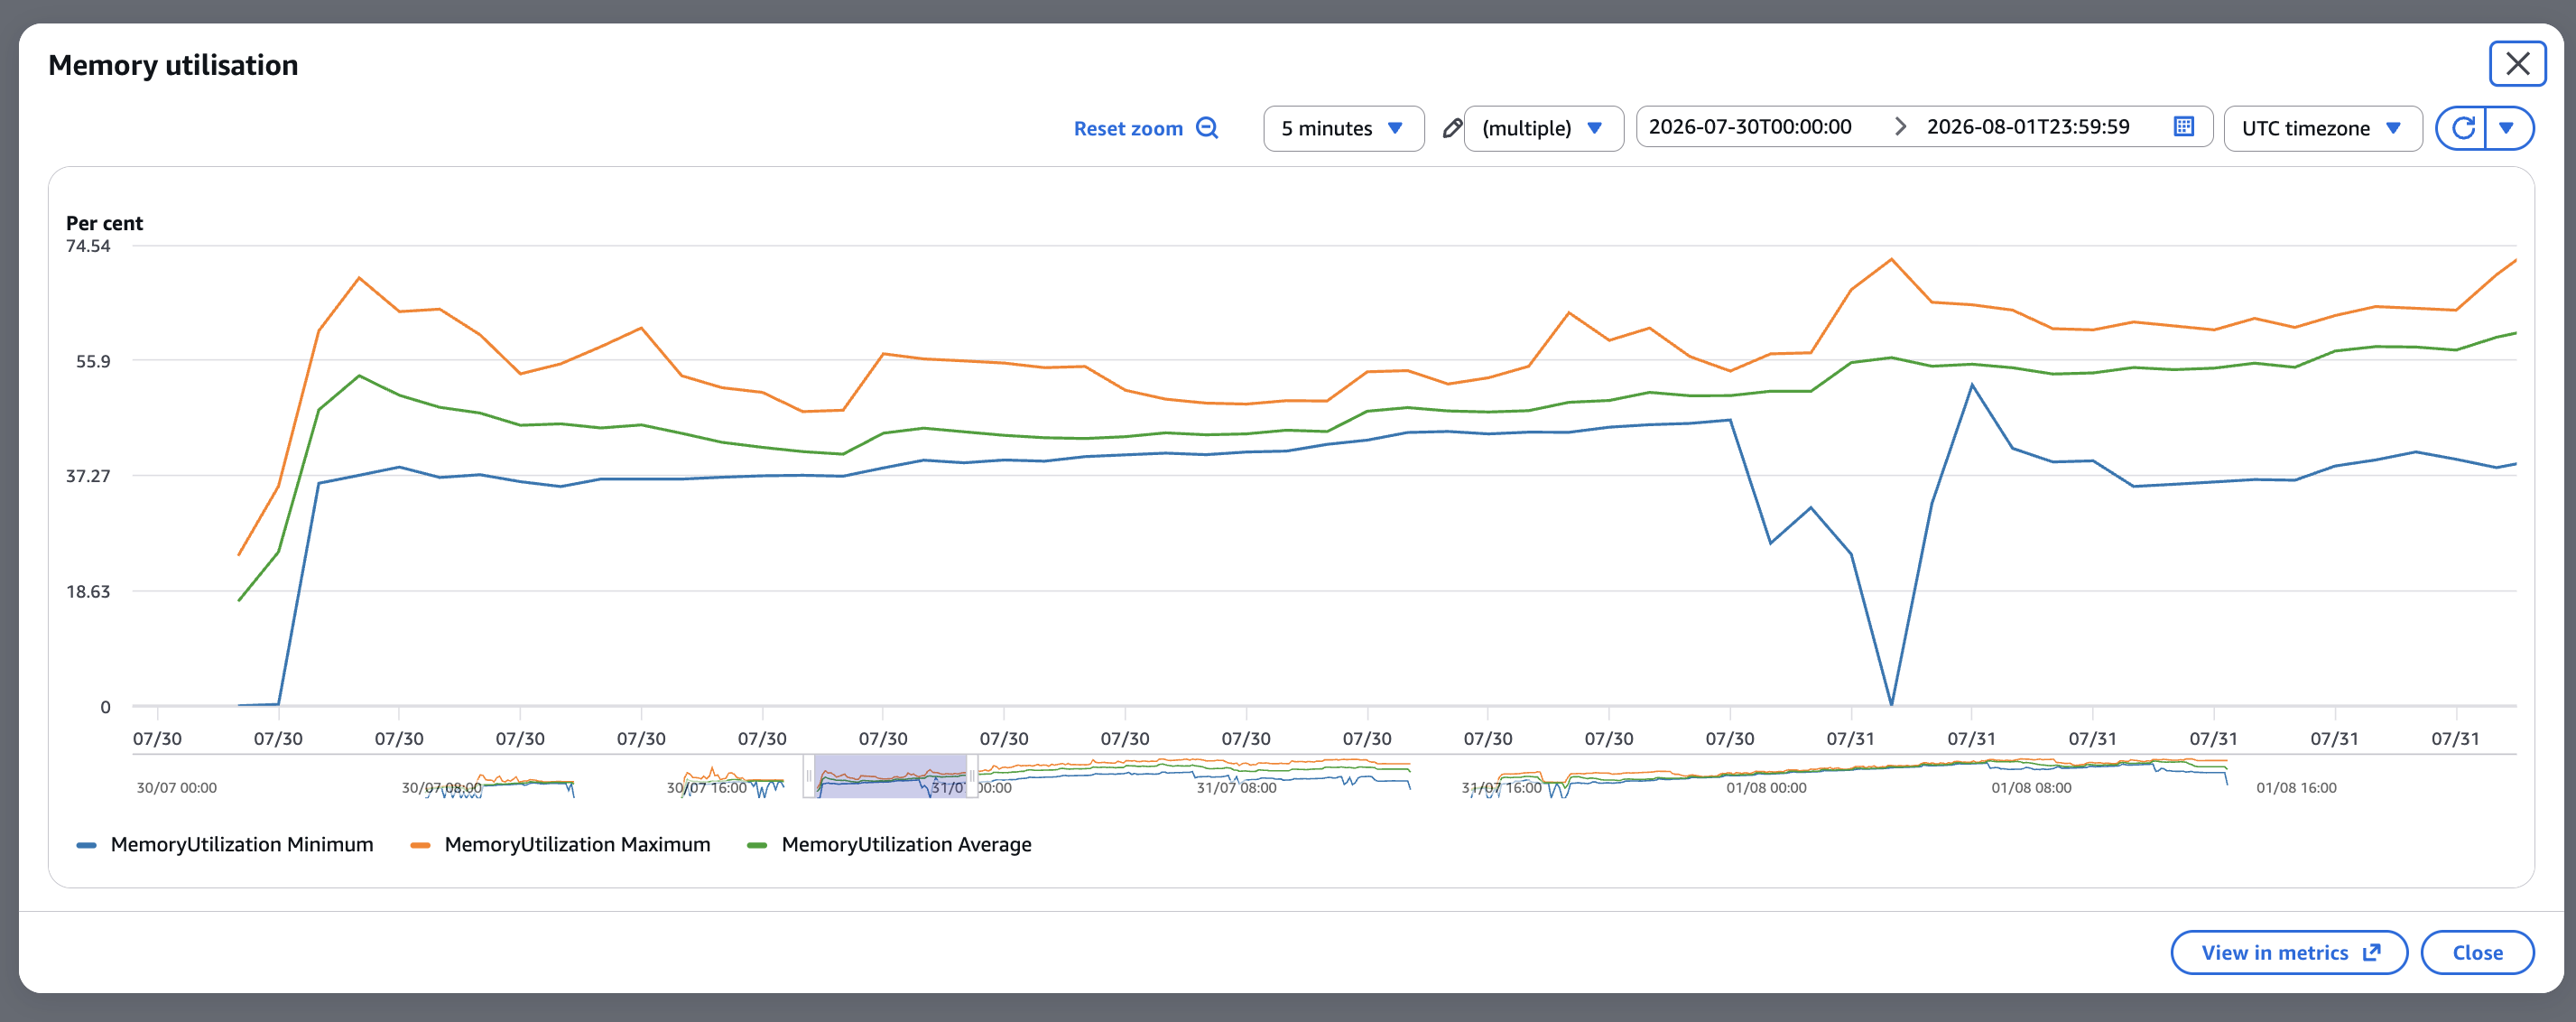
Finally, after making these changes, you can see in the memory graph below, the increase was much more gradual. Unfortunately, there was still a slope (indicating a leak elsewhere), so on with the scavenger hunt!
Finding other sources of leaks
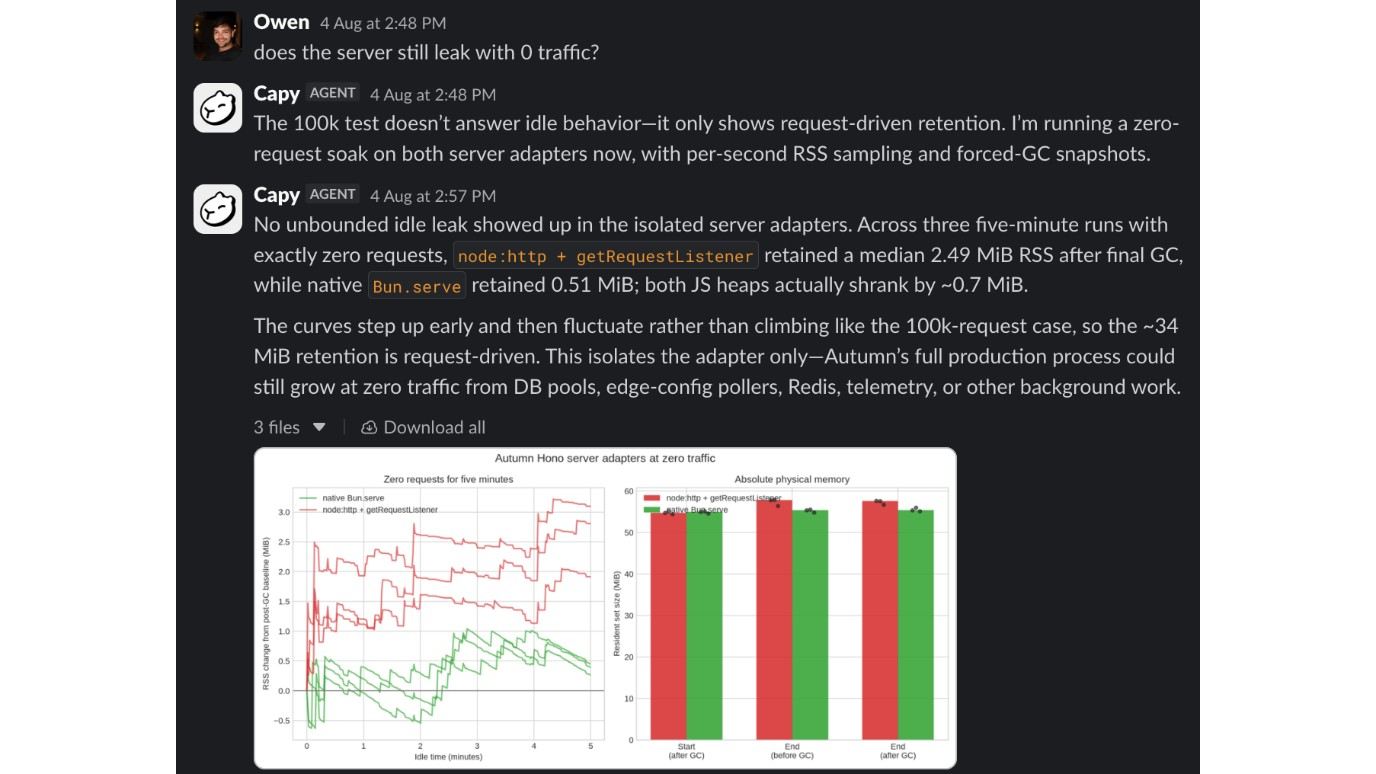
The other leaks took us quite a bit more digging, and were much more obscure than the logging one we found earlier. To figure this one out, Owen asked Capy, a cloud coding agent, via Slack to run an experiment: spin up the Autumn server and check if it leaks with zero traffic.
Sidenote: this was a bit of an eye opening moment for us towards cloud agents. Capy pretty much took a single instruction, ran the experiment fully autonomously, and produced comprehensive graphs / explanations which were pretty helpful in finding the leaks! Something like this would've taken a couple days to run ourselves. Instead, it took maybe an hour (without us having to do anything)
Anyways, it turned out that leaving our server running without any requests still caused a memory leak!
After a process of elimination, we realized that our edge config polling was causing huge memory leaks in our application. For context, an edge config is a JSON object that your server is able to read / update at runtime to quickly toggle certain behaviors (eg. if you want to change the rate limit for a particular user). We have maybe 10 - 20 different configs stored in S3 that are polled every 10 seconds.
The reason this caused a leak is due to to the same bug we found with Bun's HTTP client earlier. We were using the official AWS SDK for S3 and each GetObject request made that same fetch call which leaked memory. At the rate and frequency we were polling, this created quite a huge leak!
Fortunately, the solution here was way simpler than the investigation. All we needed to do was switch over our S3 client from the AWS SDK to Bun's native S3 client.
Node adapter leak
Finally, the last leak we found was on the inbound path. Our server is implemented as a Hono app, and is served via Bun's node adapter, instead of the native Bun.serve:
const requestListener = getRequestListener(app.fetch);
const server = http.createServer((req, res) => {
	if (drainState.draining) res.setHeader("connection", "close");
	requestListener(req, res);
});
(the reason for this is because we originally wrote our server in express, and there were a bunch of artifacts that blocked us from moving over to using Bun.serve)
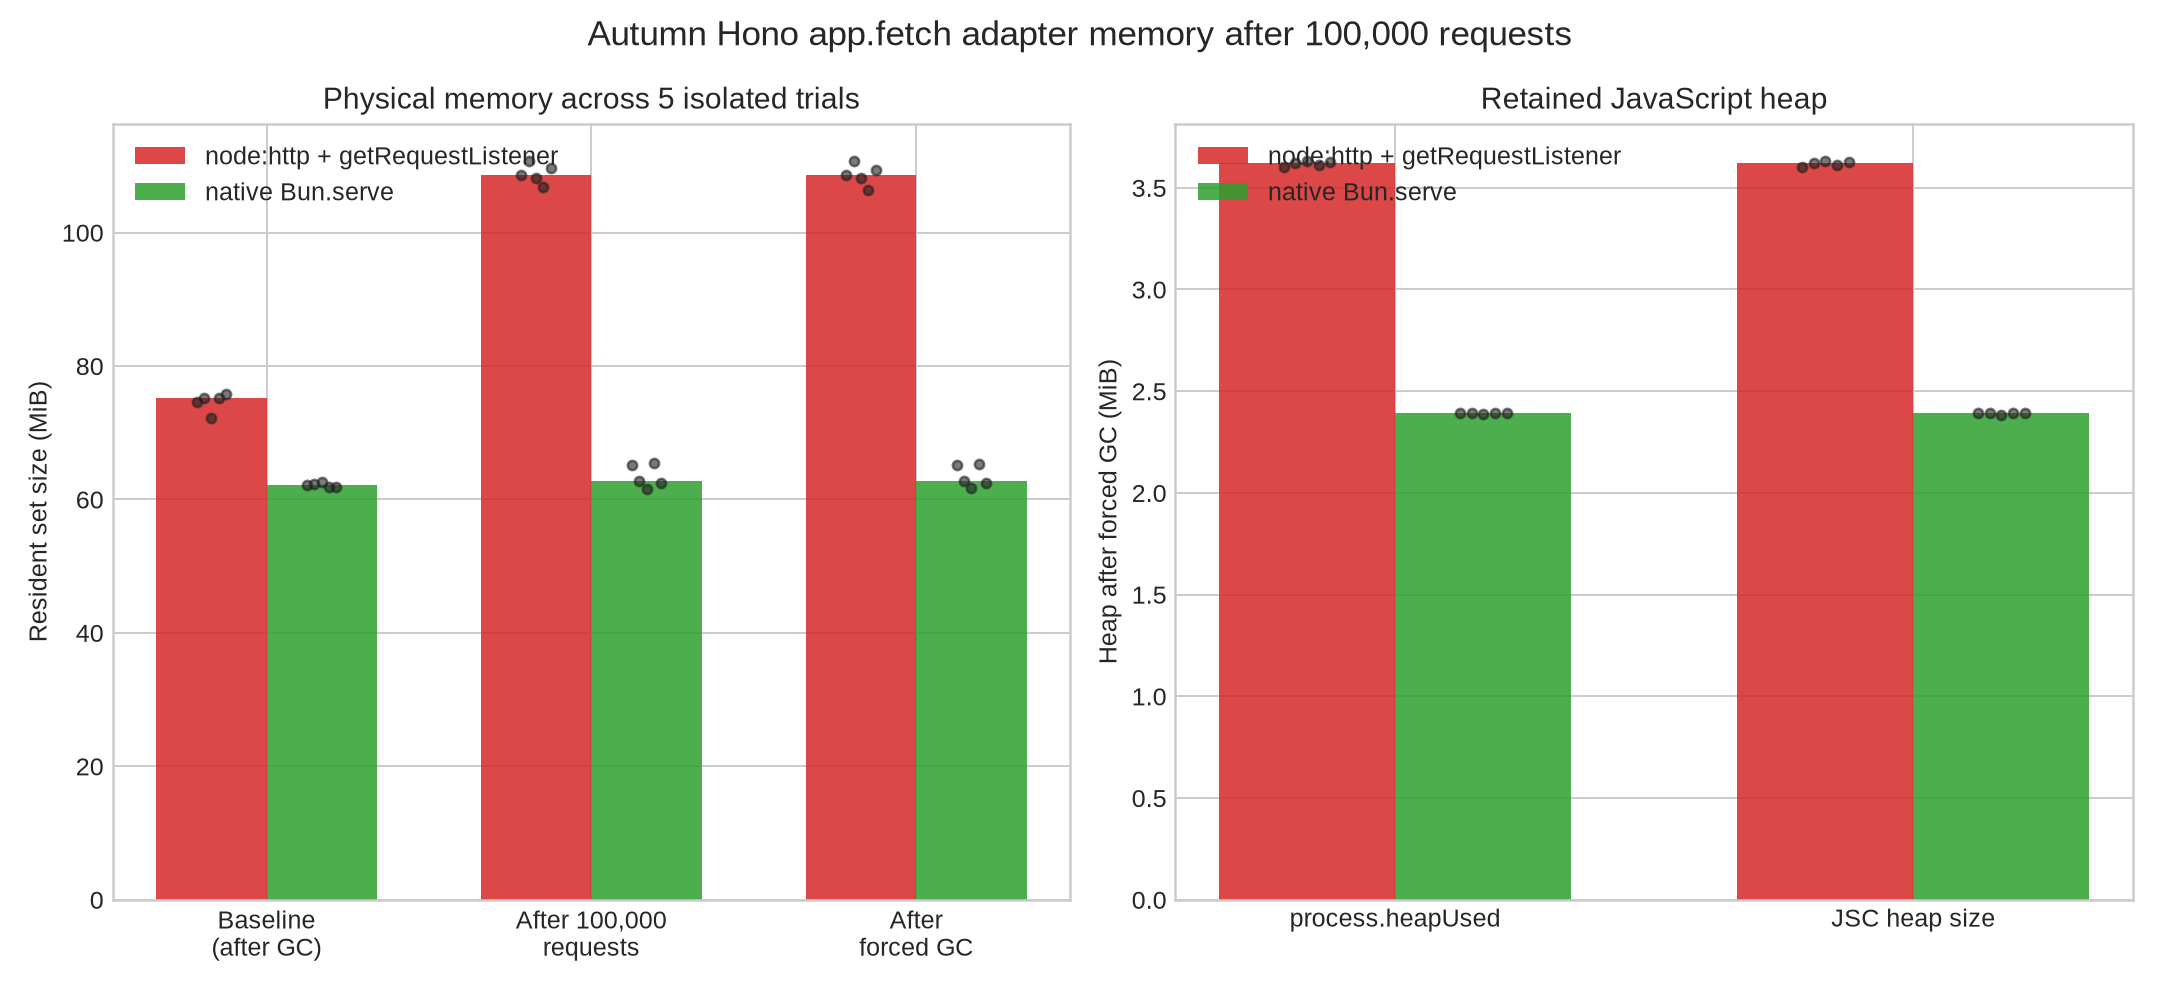
To figure this one out, we again used Capy. We asked it to run a plain Hono server (not our app) with the node adapter, send 100k requests through it and force garbage collection. We then ran a similar experiment, but this time using Bun.serve and saw the following results: about 34 MiB of RSS after 100k requests on the node adapter, versus 0.6 MiB on native Bun.serve.
Recycling tasks
Even after all this work, we unfortunately weren't able to eliminate all memory leaks from our app (since they were coming from Bun and we had a lack of control), but we did get it down to a rate low enough such that our tasks would only OOM after ~14 days. So we decided that it wasn't worth chasing down anymore leaks.
That being said, we couldn't let our server die if we didn't ship anything for 2 weeks (as unlikely as it is), and so to tie up this final loose end, we implemented a recycling policy in our app. Each ECS task runs a few child processes behind a master (using node:cluster). When any child's memory crosses a limit, we drain it and start a new one, which gives the RAM back.
A couple of reminders if you end up implementing this yourself:
- Ensure that you drain a process before recycling it, such that there are no in-flight requests that can be dropped when the process restarts.
- If you're like us and have more than one process receiving requests (which you probably do), don't let them all restart at once. Stagger the recycles.
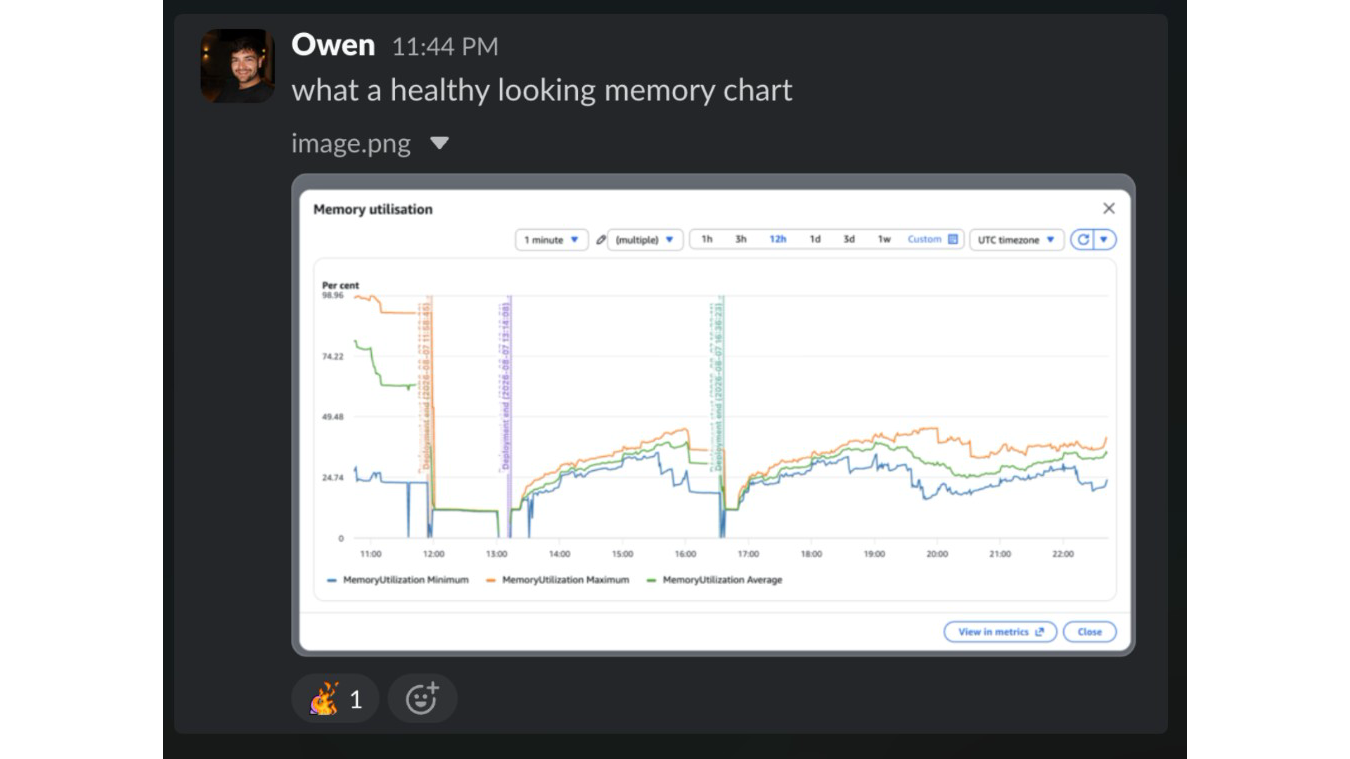
Finally, after all this work was completed, this was Owen's response to the memory:
Hopefully you found this helpful :)